 |
|
Teaching resources
The resources below can provide inspiration as you consider various approaches that will help you achieve your course goals. The collections contain a rich set of materials to draw from in constructing the specific set of learning experiences you want for your students.
General Teaching Resources
Pedagogical Approaches
How does one teach quantitative reasoning skills? These modules offer pedagogical models and examples of their use. They have been made available through the Pedagogy in Action project:
Course Development
- The City University of New York's NICHE (Numeracy Infusion Course for Higher Education) Project provides information including assessment instruments, QR learning goals, and best practices for QR instruction. Numeracy Infusion Course for Higher Education (NICHE): www.TeachQR.org
Instructional Activities
- Activities emphasizing specific QR Skills
This collection of internet resources is intended to help faculty teaching QR courses. Many of the resources are good problems, class activities, lecture notes or PowerPoint presentations that are illustrated with useful diagrams, graphs and figures.
- Teaching Activities for QR Across the Curriculum
These materials reflect the contributions of faculty members from across the country, collected by the NNN.
- Activities emphasizing Sustainability These activities show how the multidisciplinary topic of environmental sustainability can be used in classrooms across the disciplines to motivate authentic problems using quantitative reasoning.
Other Resources
- Mathematics Across the Community College Curriculum provides an extensive list of books and resources on quantitative reasoning and math across the curriculum.
- The Center for Mathematics and Quantitative Education at Dartmouth (MQED) provides a selection of curricular materials serving QL needs across a wide variety of disciplines. Modules from their Financial Literacy Project can be found at the Money Matters site.
- The SISL Web site (Sustainability Increases Student Learning) provides information about making Sustainability a theme in courses across the curriculum, including QR courses in which energy, climate change, and natural resources would be engaging topics. In particular, the Math/QR site focuses on how math and statistics feature naturally in sustainability.
- A collection of essays on the importance of quantitative literacy, Mathematics and Democracy , hosted by The Mathematics Association of America.
- Statistical Literacy: www.StatLit.org
Teaching QR via News
Teaching Quantitative Reasoning with the News
Compiled by Stuart Boersma, Central Washington University Author Profile
What is Teaching Quantitative Reasoning with the News?
This teaching method uses newspaper articles as content for the critical analysis of quantitative information. Being current and relevant, newspaper articles provide students with an easy answer to the question "When will I ever use this?" Quantitative comparisons, graphical analyses, and elementary modeling can all be approached and supported with case studies comprised of media articles.Why Teach Quantitative Reasoning with the News?
Quantitative reasoning should be a habit of mind that one engages in regularly. The daily newspaper has numerous examples illustrating the need to be able to deal critically with quantitative information in today's society. Newspaper articles provide a variety of changing contexts which emphasize the relevance of quantitative thinking in everyone's life.
Choosing/Using an Article
How to Choose and Use an article:
If one is using articles in a quantitative reasoning (QR) course, they should certainly contain numerical information (either in the article itself or, perhaps, in an accompanying graphic). The instructor should also keep in mind the specific students they are targeting. For example, a classroom full of traditional-aged freshmen may not be overly interested in the finances surrounding the purchase of a house or dollar-cost averaging while they may be very invested in the financial truths of obtaining an education. Thus, focusing on articles which stress the importance of quantitative reasoning in a relevant setting is important. Articles which are especially rich are those which allow students to:
- Ask "What if...",
- Interpret the magnitude of a quantity,
- Check the accuracy of stated facts or conduct a little research on the topic,
- Discuss how quantities were measured and who did the measuring,
- Perform a quick calculation or engage in mental estimation to check the author's claim(s),
- Convert an absolute change into a relative change or vice versa,
- Compare numerical information in the article with that presented in graphical format, or
- Become familiar with language used to represent and compare quantities.
It is important to continually reinforce the point that to be critical consumers of quantitative information, one must form a habit of mind to continually check, examine, and analyze quantitative information that is being presented.
For Example:
In today's (July 15, 2009) Washington Post, a second page article caught my eye. Headlined "Obama Announces Community College Plan" and reported by by Michael D. Shear and Daniel de Vise, a sub-headline mentioned a new $12 billion pot of money dedicated to community colleges. With many of my students coming from community colleges, the extremely large quantity of money specified indicated that this would be a good article to bring to class. After reading the article several questions and opportunities for further study came to mind. Some of the items on the following list could be developed into a more streamlined set of study questions:- Putting large numbers in a personal context: How large is $12 billion? If evenly distributed over all the nation's community colleges, how much would each college get? What percent of the school's budget is this? What types of activities could be funded with this amount of money?
- Interpreting the magnitude of a quantity: The article mentioned that this program would also "add 5 million new graduates by 2020." What is $12 billion divided among 5 million students? More details indicate that $2.5 billion goes towards construction/renovation, $500 million to develop new courses, and $9 billion for "innovation". If one is trying to decide how much money is being spent to produce another college graduate, perhaps one of these other figures should be used instead of the $12 billion.
- Absolute vs. Relative Change: The article also states that "[t]he funds would be used to support...a 40 percent to 50 percent increase in the number of people who graduate from a community college..." while "[c]urrently, about 1 million students graduate from community colleges each year." How do these two statements compare with the "5 million new graduates by 2020" statement?
- Opportunity for student research: For a local community college, students could collect information such as a) what is the current budget for instruction? b) what is the recent enrollment history? c) how does this compare to the recent budget history? d) any estimates on how much money it would take to increase enrollment by 40 to 50 percent?
- Discuss how quantities were measured: Should success at a community college be measured by a "graduation" rate? What about students which successfully transfer from a community college (without a degree) to a four-year college or university?
Or:
A short financial advice column in July 16 Washington Post addressed the lower interest rates that affect today's savings accounts. The article claims that "a 2 percent interest rate with 1 percent deflation these days is worth as much as a 6 or 7 percent interest rate was under normal inflation conditions." A few questions which immediately come to mind are:- Check author's claim: Can one easily check this out? Do you simply add/subtract percentage points or does one have to consider compounded interest?
- Opportunity for student research: What was the inflation rate when interest rates were 6-7%?
- Ask "What if...": Have students make the relevant assumptions about interest rates and inflation/deflation rates and use a spreadsheet to model several years' worth of a savings account balance.
Or:
In an Op-Ed piece in the Washington Post on July 16, there is a statement that "the college-going rates of the highest-socioeconomic-status students with the lowest achievement levels is the same level as the poorest students with the highest achievement levels." This single statement brings to mind a task one might ask students to perform:- Understand language: Give some examples with specific numbers which help explain the statement this author is making. Explain if this points to a social concern.
How to Use an article (pedagogical motivation):
After choosing an article or advertisement that has some "quantitative depth" to it, one must decide how best to make use of the article in class. Some of the most common uses are described briefly below:
- Introduction of concept: An article can be used to introduce a topic. When used in this fashion an instructor should prepare a set of framing questions used to get students to begin to think about the concept, its importance, and its applications. For instance, in the first example above one may introduce the concept of absolute and relative change. Most of the dollar figures are given in absolute terms (an increase of $2.5 billion for construction/renovation), but one may wish to know what the relative change is ($2.5 billion represents what percent of the total budgets for all community colleges).
- Further exploration of concept: Often articles will be used to continue to explore and/or develop ideas and concepts. For example, if the article in the second example above were read after students have become familiar with the notion of simple and compound interest, students could determine which (if any) of these two concepts were most relevant.
- Brief review of concept: Concepts covered in depth earlier in the course will naturally be revisited at later dates as dictated by the articles being read at that time. For instance, the third example above can be used to review the "spread" of distributions.
- Assessment of concept: Any concept, skill, or technique that has been emphasized in class can be assessed via another article. Unlike many other assessment strategies, using a variety of articles to introduce, explore, develop, and assess a skill naturally requires a high degree of transferability. In all likelihood, students will be assessed with an article which uses different language, different contexts, and different settings than ones with which they learned the skill.
How to Use an article (implementation):
In general, longer articles should be handed out the day before so they can be read before class begins. Instructors may wish to formalize the reading assignment by attaching some brief accountability to it. For instance, one may require each student to email a short two or three sentence summary to the instructor before class begins. The actual study questions may be used in a variety of formats, the most common being:
- Class discussion: Use the article and several carefully constructed framing questions to instigate a class discussion of the topic/concept under consideration.
- Group work: Working in small groups of three or four, students can work through the study questions associated with the article.
- Individual assessment: Some or all of the study questions can be assigned for individual homework. Additionally, students could be asked to write a mock letter to the editor or to the reporter summarizing their analysis of the article and pointing out any discrepancies or ambiguities they uncovered.
- Creative combinations: For longer articles that have numerous study questions, employing combinations of all of the above pedagogical strategies works well. Having read the article before coming to class, students can discuss their first impressions in small groups. A class discussion helps focus the students on the main quantitative concept under consideration and a short overnight writing assignment assigns individual accountability for each student. This cycle which begins and ends with the individual student is shown below:
A word on technology: Having access to a variety of technology is helpful. A document cam makes it easy for instructors or students to share daily articles. A computer in the classroom makes it possible to pull up internet resources (e.g. online newspaper sites and U.S. census data) and make use of spreadsheets as needed. Access to a computer for every student is not necessary, but having at least one in the class can be helpful (many students read their news online and the online presentation may be more appealing than a printed version).
Challenges:
- Teaching with the news provides elements of surprise and serendipity. However, taking the time to assemble a fair amount of material before the first day of class allows for a more topical approach. Current articles may still be brought to class several times a week in an effort to keep the topics current.
- Teaching with the news may make an instructor feel constrained by the topics covered and, possibly, the depth of coverage. Quantitative topics may not covered if they are not needed to understand or analyze a newspaper article. If one always wishes to introduce their students to a favorite topic (distribution of prime numbers, Euler characteristic, countable v uncountable sets, etc.) this may not be possible if you require the content to be driven by an actual newspaper article. Also, if one were to cover linear and exponential growth in a standard mathematics course, one might cover it at a depth not necessary for understanding media articles.
- Teaching with the news requires an instructor adept at facilitating discussions. Some skill is needed to keep up a well-focused discussion on the quantitative reasoning while also keeping the course moving along. Instructors need to make sure that these discussions take place by reducing the amount of time typically spent lecturing.
- Teaching with the news requires an instructor assess written work. Take time to explain to the students what the classroom expectations are: complete sentences, correct grammar and punctuation, clear and precise explanations, correct use of quantitative terms, etc. Creating a rubric and sharing this rubric with students can help out significantly.
Tips for the first time:
- Begin gradually. Use a few relevant newspaper articles to supplement a QR course that you are already familiar with. Adopt the habit of perusing a daily paper and identifying articles which exemplify the type of skills you are expecting of your students.
- Have 80-90% of the articles to be studied assembled ahead of time and organized into topics with specific learning objectives. This gives you a safety net in case it is difficult to find articles on a daily/weekly basis. Be sure to prepare a list of study questions for each article.
- Clearly articulate your assessment strategies to your students. Make sure students understand what they will be required to "know" and how you plan to grade written responses on homework or in-class tests. Consider creating a grading rubric which identifies the characteristics of an outstanding written response.
- Decide on your class standard for language regarding absolute v relative percent change. This is the only way one can "test" for this knowledge later on. For example, if the unemployment rate changes from 6% to 8% how will you expect your students to articulate this change? (A "change of 2 percent" is probably too ambiguous since in this case those two percentage points account for about 33% of the beginning unemployment rate.)
- Decide how you plan to encourage students to bring in their own articles and how you convey the characteristics of an interesting article.
Classroom Resources
Classroom Resources
- The Visual Display of Quantitative Information is a great resource for those looking to bring in some extremely well-produced graphical displays of numeric information. This book may be used to identify features of an effective graph which will help when analyzing graphics which appear in local and national newspapers.
- Joel Best (2008) "Birds–Dead and Deadly: Why Numeracy Needs to Address Social Construction," Numeracy: Vol. 1 : Iss. 1, Article 6.
Available at: Numeracy 1 (1). Offers the reader an introduction to the notions of "socially constructed numbers" and provides two excellent examples culled from the media.<\li> - The CHANCE project provides some excellent resources on using current events in the statistics classroom. In particular, the "Chance News" feature alerts visitors to interesting items in the news which would make for great case studies.
- The U.S. Census Bureau is a valuable resource when trying to find additional information about populations, housing estimates, income distributions, and much more. As this site can sometimes be hard to navigate, instructors may wish to spend some time before their class starts familiarizing themselves with the information it contains. Also, many state government websites offer similar information presented on county and city levels.
- Wolfram Alpha is a website which offers, among more mathematically advanced calculations, some interesting numerical displays and interpretations. Operating like a mathematical search engine, it has access to some interesting databases. For example the term "population united states/mexico" is interpreted mathematically as the ratio of the populations of the U.S. and mexico. A value and a graph which displays this ratio over the last 30 years is returned. The term "bmi" returns a numerical and graphical description of the body-mass index for the United States. The term 'federal budget' returns, among other items, a log-scaled plot of about 60 years of data on the U.S. budget.
Research and Pedagogy
- Numeracy (more info) is an open-access peer-reviewed journal which publishes articles, editorials, and perspectives on quantitative literacy across all disciplines. Past issues include articles on assessment strategies, curriculum design, classroom activities, as well as book reviews.
- SIGMAA-QL is a special interest group of the Mathematical Association of America (MAA) dedicated to the improvement of quantitative literacy in higher education. It's members host many paper/poster sessions and panel discussions at the national meetings of the MAA.
- The Cooperative Learning Center at the University of Minnesota (more info) provides visitors with resources to support cooperative learning initiatives in their classrooms. Teaching with the News can make very effective use of cooperative learning.
- Peer-Led Team Learning illustrates how to incorporate formal peer-to-peer instruction into the classroom. News-based courses are very amenable to group work, cooperative learning strategies, and peer-to-peer instruction techniques.
- Student Research offers some advice on incorporating student research in the classroom. Many news articles can be used as the basis for longer research projects in which students follow up on sources and collect their own facts.
- Quantitative Writing provides some excellent advice on getting students to write about numbers.
Since many of the quantitative skills encountered in a news-based course are relatively elementary, students come to class with many pre-formed ideas. Instructors need to be aware of what these preconceptions are and how they may affect one's learning or understanding. A few sources which describe the recent cognitive research on how students construct knowledge as well as pedagogical approaches one may use in the classroom to address this issues are found below:
- Implications of Learning Research for Teaching Science to Non-Science Majors
- Survey Your Students, part of SERC's Pedagogy in Action.
- Diagnostic and Formative Assessment, part of SERC's Pedagogy in Action.
Quantitative Writing
Quantitative Writing

This material was originally developed as part of the Carleton College Teaching Activity Collection
through its collaboration with the SERC Pedagogic Service.
What is Quantitative Writing?
Quantitative writing (QW) is the written explanation of a quantitative analysis. A good quantitative writing assignment engages students with an open-ended, ambiguous, data-rich problem requiring the thinker to understand principles and concepts rather than simply applying formulae. Assignments ask students to produce a claim with supporting reasons and evidence rather than "the answer." Such "ill-structured problems" thus differ from writing assignments that lack a quantitative dimension as well as from "story problems" in math courses. Quantitative writing assignments can take a variety of forms, genres, and complexities.Why use Quantitative Writing?
Quantitative writing is a powerful tool for enhancing student learning. By emphasizing the exploration of ill-structured problems, QW teaches students the flexible, adaptive, analytical higher-order strategies necessary for the increasingly complex, data-rich environments of the 21st Century. Quantitative writing models and encourages domain transfer. QW assignments require students to analyze and use qualitative data in rhetorical contexts. They also promote the quantitative and writing skills need for 21st Century citizenship and careers.How to use Quantitative Writing?
There are numerous ways to use quantitative writing, but they all start with careful thinking about how QW contributesto the course's learning goals. Designing effective QW assignments involves several steps:
- Identifying & Prioritizing the goals of the assignment,
- Choosing a topic and a type of QW assignment,
- Deciding how much scaffolding to provide, and
- Deciding on criteria for assessment.
Quantitative Writing Examples
Using quantitative writing (QW) effectively involves a variety of issues:
Whether you are a long time user of quantitative writing assignments or a novice, the decision about how (or whether) to incorporate QW assignments into your course begins with the same question: How will they contribute to the course learning goals?
QW assignments shouldn't be added to a course for their own sake. Rather, they should only be added when they contribute to a course learning goal. Therefore, the first step in thinking about how to use quantitative writing is to explicitly identify your learning goals for the course (typically a short list of 5-8 statements). Learning goals state what a student earning a high grade should be able to do. They typically include an active verb following the phrase "students will be able to . . . ."
Here is an example from an economics course of a learning outcome that could be implemented using a quantitative writing assignment:
"Students will develop effective arguments on economic issues by asking appropriate economic questions, analyzing quantitative data, and using these data evidentially in ways appropriate to the discipline." (Dean Peterson, Associate Professor of Economics, Seattle University)
Once you have identified learning goals that lend themselves to quantitative writing, the next step is to design specific QW assignments.
Designing Effective QW Assignments
The key to designing an effective Quantitative Writing (QW) assignment is planning carefully. What exactly do you want the students to accomplish? Spell this out on a handout or a web page. If you don't specify what you want, you can be sure that at least some students will not give it to you. For example, if you expect students to appeal to the data as evidence in their argument, then say so. Sometimes students don't think to do that.
Good design incorporates at least three steps:
- Identifying and prioritizing the goals of the assignment. Begin your planning by identifying specific learning goals for the assignment. These might include:
-
- Familiarity with a specific data source,
- Showing mastery of a particular concept or theory, or
- Answering a specific question.
- Familiarity with a specific data source,
Once you've identified your goals, you should consider how a QW assignment can support them. QW assignments shouldn't be "yet another thing" to cram on a syllabus, but rather a means of doing better what you are already trying to do. Is one learning goal more important than the others? Design the assignment so that students will spend their time on the portions that are most important to you.
- Defining the assignment. The next step is to define the assignment: that is, to choose a topic and decide what type of assignment will best meet your leaning goals.
Good topics for QW assignments immerse students in the analysis of quantitative data relevant to the subject matter of your course. Problems should be open-ended rather than asking for discrete answers. Problems can range from the simple to the very elaborate and can be used either for formal writing assignments or for short exploratory writing. Note that good topics for class discussion often work well as writing assignments.
One way to create a good QW assignment is to base it on a compelling reading. Students can come to understand the real-life stakes underpinning the use of quantitative reasoning when they read persuasive works that interpret quantitative data in different ways or that otherwise use quantitative arguments to support alternative positions. Short books written by experts to lay audiences are often good examples of this type of reading.
Once you've decided on a topic, you'll need to choose an appropriate context for the assignment. Context includes several dimensions: What genre of writing assignment should be used? To whom should the writing be addressed? What should the author's purpose be in the assignment? For example, the purpose could be to persuade readers of a particular point of view. Note that 'purpose' here is a bit different than the instructor's goals of the assignment.
- Decide how much scaffolding should be provided. Scaffolding means how much structure you provide for the assignment. Scaffolding helps students complete the assignment successfully, but the more scaffolding you provide, the less challenging the assignment will be.
Deciding on Criteria for Assessment
While you are designing the assignment, you should also decide on criteria for assessment. You should communicate those criteria to students on the assignment sheet. QW assignments ask students to explain in writing the answer to an analytical problem. Good assignments, however, go beyond asking a student to convert mathematics to words. Rather, they ask students to interpret the mathematical results.
- Good assignments invite students to consider questions like:
- What assumptions is this analysis based on?
- How good are the data on which this analysis is based? Are they from a reputable source?
- What conclusions do you draw from the analysis?
- What evidence supports those conclusions?
- Think about what aspects of the assignment require exact answers (e.g. identifying the mean unemployment rate during the 1990s) and what aspects require analysis or drawing of conclusions (e.g. to what extent was unemployment a serious problem in the 1990s).
- Common problems in lower level assignments are conclusions without evidence, or evidence which doesn't really support the conclusions - the students knew that evidence was necessary, but they didn't find the right evidence, perhaps because they started with their conclusion.
- Always require complete citation information for data sources, so that you can find the exact data the student used. Many students think that an adequate citation for a data source is 'economagic.com'.
- Consider designing a grading rubric for the assignment. Rubrics (or grading guides) are helpful both for students who are writing the assignment and instructors who are grading it, since they reveal what the instructor is looking for in the assignment.
Framing the Assignment as a Process
Most principles of good writing apply to quantitative writing as well. Good writing should be viewed as a process rather than a product. Few writers can produce a finished copy in one draft; most writers require several drafts often making significant global changes between them as a result of discovering new ideas and of trying to meet the needs of readers for forecasting, clear topic sentences, headings, good transitions, and unified and coherent paragraphs. Here are some ways to encourage students to take their writing through multiple drafts:
- Emphasize exploration, reflective research, multiple perspectives. Consider using class time to generate ideas for papers and to help students role-play different points of view.
- Encourage imperfect first drafts. Explain to students that writers often use first drafts just to get ideas out on the table and to begin uncovering the complexity of the topic. Often writers can overcome writer's block by lowering expectations on the first draft. Suggest to students that they can call their first draft a "zero draft," a "discovery draft," or a "see-what I'm thinking" draft.
- Stress substantial revision reflecting increased complexity and elaboration of thought and increased awareness of readers' needs. Often bringing in examples of your own drafts-in-progress helps students understand that their teachers also struggle with writing and need to work their ideas through many drafts.
- Write comments that encourage revision, emphasizing the higher order concerns of ideas, thought content, organization, and development. Where possible, make comments on students' drafts before the final due date. An alternative to reading drafts is to allow rewrites of some papers for a higher grade.
- Requiring multiple drafts of an assignment is another form of scaffolding. While it is good practice to ask students to write multiple drafts, there is an opportunity cost here: time and effort spent on revising is time and effort that can't be devoted to another assignment. One solution is to have subsequent assignments build on the earlier ones so that a formal rewrite isn't required.
- Consider instituting peer review workshops. Peer review helps the reviewers become better writers. To the extent that peers are able to identify problems in student papers, peer review also reduces the workload of the instructor. For suggestions on how to conduct peer reviews, see Peer Editing Guide (more info) .
Challenges in Using Quantitative Writing
When you begin incorporating Quantitative Writing into your courses, you may feel like you are 'flying without a net' but as the image to the right shows, there are some safety wires if you just know how to connect them. In this section, we discuss some common challenges when using QW, and how those challenges can be overcome, for example, by using common practices from colleagues in the Composition field.
- Few Ph.D.s have been trained as writing instructors. How can we possibly teach student writing and how can we efficiently assess it? While this concern is not uncommon, it is probably overblown. Do you call on your students in class and expect them to respond to your questions orally? Most of us do. Have you been trained to teach oral communications? Most of us have not. At the same time, we have little difficulty in calling on students and assessing their responses in terms of the subject-matter they express. Additional information about grading student writing is provided in the section on assessing student writing.
- Effective Strategies Exist for Managing the Paper Load
- Regardless of the type of assignment, good writing has several common elements. If you only teach students to adopt these elements in their writing, you will have improved the writing of the majority of undergraduates.
References on Quantitative Writing
References on Quantitative Writing
Handbooks:
Miller, Jane E. (2004). The Chicago Guide to Writing About Numbers. Chicago: University of Chicago Press.
Miller, Jane E. (2005). The Chicago Guide to Writing About Multivariate Analysis. Chicago: University of Chicago Press.
Other
Abelson, R. P. (1995). Statistics as principled argument. Hillsdale, NJ: Lawrence Erlbaum Press.
Bain, Ken and James Zimmerman, "Understanding Great Teaching," Peer Review, Spring 2009, Vol. 11, No. 2.
Bransford, John D., Ann L. Brown, and Rodney R. Cocking, Eds. 1999. How People Learn: Brain, Mind, Experience and School. Washington, DC: National Academy Press.
Bean, John C. and David Carrithers. 2005. "Teaching Audience Adaptation and Critical Thought in Business Case Assignments." Proceedings of the European Association of Teachers of Academic Writing.
Bean, John C., Theresa Earenfight, and David Carrithers. "How University Outcomes Assessment Has Revitalized Writing-Across-the-Curriculum at Seattle University." WAC Journal: Writing Across the Curriculum, 16 (2005): 5-21
Best, J. (2004). More damned lies and statistics. Berkeley: University of California Press.
Burke, Michael and Jean Mach, Salmon Essay - Tools for Thought Learning Community,College of San Mateo.
Dawson, Melanie, Peer Editing Guide (more info) , (Archived Version)
Holston, V. and C. Santa, 1985, A method of writing across the curriculum that works: Journal of Reading, v. 28, p456-457.
King, P. M. and K. S. Kitchener, 1994, Developing Reflective Judgment: Understanding and Promoting Intellectual Growth and Critical Thinking in Adolescents and Adults: Jossey-Bass, San Francisco.
Knoblauch, C.H. & Lil Brannon 1983. "Writing as Learning Through the Curriculum." College English. 45, No. 5 (September) 465-474.
Mathematical Association of America, 1998, Quantitative Reasoning for College Graduates: A Complement to the Standards (more info)
Ramage, J. D., Bean, J. C., & Johnson, J. (2007). Writing arguments: A rhetoric with readings. NY: Pearson.
Rutz, Carol, & Grawe, Nathan D. (2009, December 3). Pairing WAC and quantitative reasoning through portfolio assessment and faculty development . [Special issue on Writing Across the Curriculum and Assessment] Across the Disciplines, 6.
Steen, L. A. (Ed.) (2001). Mathematics and democracy. Princeton, NJ: National Council on Education and the Disciplines.
Stevens, Dannelle D. & Levi, Antonia J. (2004). Introduction to Rubrics: An Assessment Tool to Save Grading Time, Convey Effective Feedback and Promote Student Learning. Alexandria, VA: Stylus. [https://styluspub.presswarehouse.com/clients/sty/Books/BookDetail.aspx?productID=92939]
Assessment
Assessing Quantitative Literacy
Quantitative assessment seems to be of two kinds: content and attitudes. An example of each kind is given here with a link to many more examples.
AAC&U Quantitative Literacy VALUE Rubric
The VALUE rubrics were developed by teams of faculty experts representing colleges and universities across the United States through a process that examined many existing campus rubrics and related documents for each learning outcome and incorporated additional feedback from faculty. The rubrics articulate fundamental criteria for each learning outcome, with performance descriptors demonstrating progressively more sophisticated levels of attainment. The rubrics are intended for institutional-level use in evaluating and discussing student learning, not for grading. The core expectations articulated in all 16 of the VALUE rubrics can and should be translated into the language of individual campuses, disciplines, and even courses. The utility of the VALUE rubrics is to position learning at all undergraduate levels within a basic framework of expectations such that evidence of learning can by shared nationally through a common dialog and understanding of student success. https://www.aacu.org/value/rubrics/quantitative-literacy
Dartmouth Mathematics Attitude Survey
At Wellesley College we have used the Mathematics Attitude Survey developed by a team at Dartmouth with NSF support and we have found it to be very helpful in measuring changes in attitudes for our QR students. The 35 item Likert scale survey is quick and easy to administer as a pre- and post- Assessment.
Here's an article that includes info and the Assessment instrument itself on page 29 of 32. https://math.dartmouth.edu/~matc/Evaluation/humeval.pdf Corri Taylor, Wellesley College, Former President of NNN.
Other Assessments
- Examples of assessment questions (Acrobat (PDF) 871kB Apr4 08) from Wellesley College's Quantitative Reasoning Program.
- The NSF funded Quantitative Literacy and Reasoning Project, awarded to Bowdoin College, supports the creation of a non-proprietary instrument for assessing QLR (Quantitative Literacy and Reasoning).
- The QuaRCS instrument developed by the Follette Lab.
- Reasoning tests: numerical, basic numeracy, financial, abstract, inductive, etc.
- See the NICHE list of QR assessments, which includes assessments for critical thinking, numeracy, math anxiety, health numeracy, and other topics.
QR/QL Textbooks
Current Texts for Teaching Quantitative Literacy and Reasoning
The textbooks shown are those authored by NNN members.
 ;
;
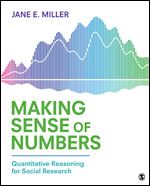
- Making Sense of Numbers: Quantitative Reasoning for Social Research, by Jane Miller.
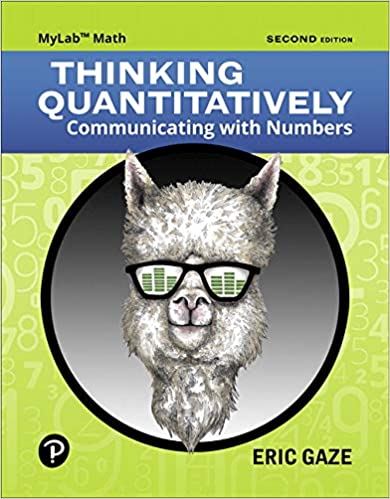
- Thinking Quantitatively: Communicating with Numbers (2nd ed.), by Eric Gaze
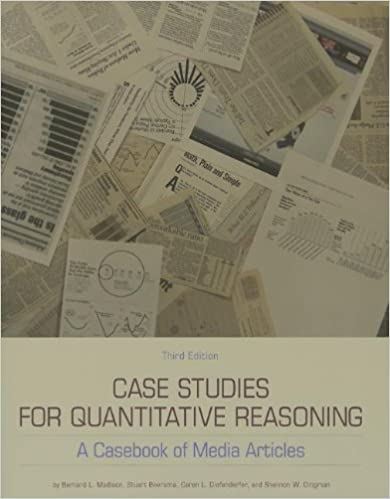
- Case Studies for Quantitative Reasoning (3rd ed.) by Bernie Madison, Stuart Boersma, Caren Diefenderfer and Shannon Dingman.
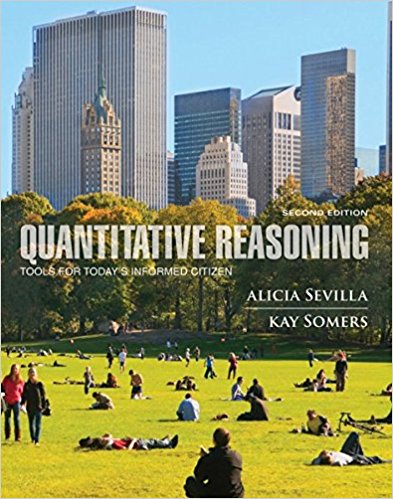
- Quantitative Reasoning: Tools for Today's Informed Citizen (2nd ed.) by Alicia Sevilla and Kay Somers
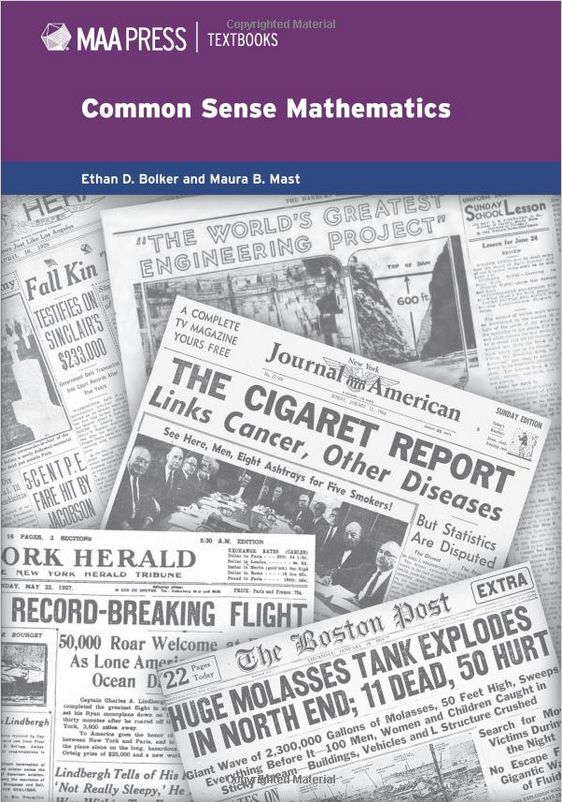
- Common Sense Mathematics (2nd ed.) by Ethan Bolker and Maura Mast.
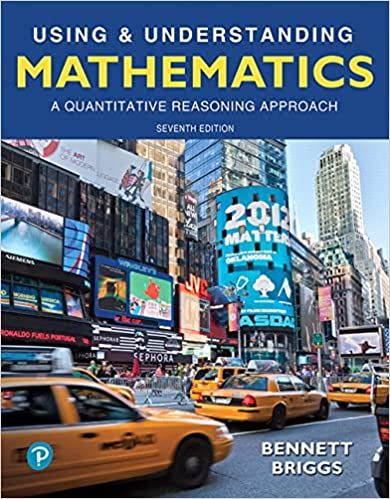
- Using & Understanding Mathematics: A Quantitative Reasoning Approach (7th ed.), by Jeffrey Bennett and William Briggs
- Statistical Literacy: Critical Thinking about Everyday Statistics , by Milo Schield
Presentation on this site does not mean they are authorized or approved by the NNN. It does mean that they are in alignment with the mission and goals of the NNN.
Other QL Books
QL trade books for professionals and the general public.
Books on this page are authored by NNN members.
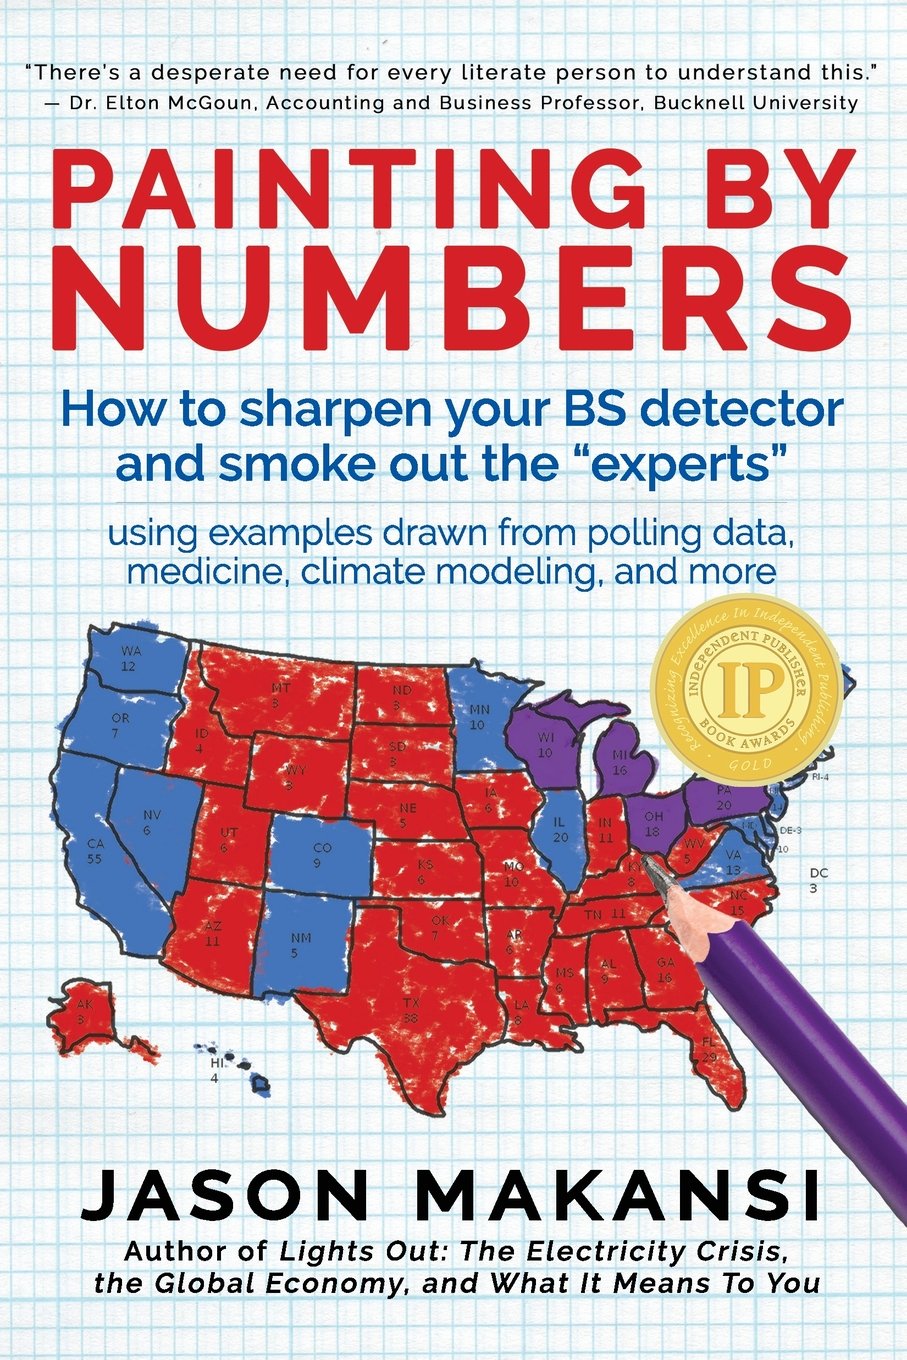
- Painting by Numbers by Jason Makansi. Amazon $13 Barnes & Noble Independent bookstores "How to sharpen your BS detector and smoke out the "experts."
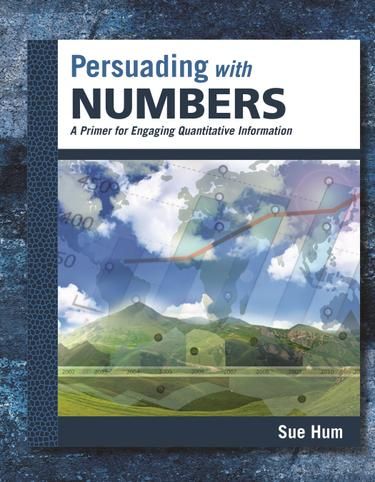
- Persuading with Numbers by Sue Num (UTSA). Kona publishing $62 ($82 w tax & ship). A primer for engaging quantitative information." Table of Contents
Academic support and professional development
Quantitative and Math Center Resources
Providing Open-Access Know How for Directors of Quantitative and Mathematics Support Centers
Michael Schuckers, Mary B. O'Neill, and Grace Coulombe
Envisioning a Quantitative Studies Center: A Liberal Arts Perspective
Authored by Gizem Karaali, Philip I. Choi, Sara Owsley Sood, and Eric B. Grosfils
Handbook for Directors of Quantitative & Mathematics Support Centers This handbook is a resource for people who lead, manage or direct Mathematics and Quantitative Support Centers (QMaSCs). In the chapters below, directors will find information about how to 1) manage a center, 2) interact with other entities on their campus, 3) train and build a staff, 4) assess their center, and 5) start a new center. Each chapter has been written by an experienced center director recognizing the diversity of QMaSCs. Additionally, there are ten case studies authored by directors representing a range of centers, from community colleges to liberal arts colleges to large research institutions.
The Math Learning Center Leaders This group of mathematics center leaders and mathematics education researchers meets biweekly online and annually at the Research in Undergraduate Mathematics Education (RUME) conference. Our aim is to support the leaders of mathematics learning centers and to utilize research to improve mathematics learning centers at a wide variety of universities in the United States of America and around the world.
Speakers
One of the key aspects of the NNN is the network of professionals eager to help others in promoting education that integrates quantitative skills across all disciplines and at all levels. Here we provide very brief bios of some of our NNN members who are available to serve as speakers or consultants. Please contact the individuals directly if you wish to engage them at your own institution.
Kate Follette, Amherst College
Kate is a Professor of Astronomy at Amherst College. She teaches courses in physics and astronomy, and crusades for an emphasis on quantitative literacy across the undergraduate curriculum. E-mail Kate
Eric Gaze, Bowdoin College
Eric Gaze directs the Quantitative Reasoning (QR) program at Bowdoin College, he is a past chair of SIGMAA-QL (2010-12), a board member of the NNN (2010-13), and past NNN President (2014-2018). E-mail Eric
Nathan Grawe, Carleton College
Nathan Grawe is Professor of Economics at Carleton College where he has helped lead the Quantitative Inquiry, Reasoning, and Knowledge (QuIRK) initiative. E-mail Nathan
John R Jungck, University of Delaware
What does it mean to observe, look, see? How does quantitative reasoning inform our appreciation of the visual world? I argue that we need to do re-visioning to develop insight. E-mail John
Bernie Madison, University of Arkansas
Bernard L. Madison, professor of mathematics at the University of Arkansas and founding president of the National Numeracy Network, has worked in quantitative literacy (QL) for more than a decade.E-mail Bernie
Cat McCune, Smith College
Cat is a former math professor and the founding director of the Spinelli Center for Quantitative Learning. In addition to running a tutoring program and teaching undergraduate math courses, Cat works to create community among quantitative reasoning professionals. E-mail Cat
Victor Piercey, Ferris State University
Victor is a professor of mathematics and director of the honors program at Ferris State University, Big Rapids, MI. He has worked with quantitative reasoning for over a decade, focusing on adapting QR for different professional audiences and integrating ethics and social justice. E-mail Victor
Milo Schield, Augsburg University (Emeritus)
Milo, a Visiting Professor at New College of Florida (Emeritus in Business Administration at Augsburg University), has worked on statistical literacy for almost 30 years. Milo is the author of the textbook: Statistical Literacy: Critical Thinking about Everyday Statistics (2023). His research papers are available at www.StatLit.org/Schield-pubs.htm. E-mail Milo.
Luke Tunstall, Trinity University
Luke is the Director of Trinity’s new Quantitative Reasoning and Skills (QRS) Center. Luke is heavily involved in the quantitative literacy movement in higher education, and is committed to fostering students’ quantitative reasoning practices across the disciplines. He is keenly aware of the complex relationship between quantitative literacy and social justice. E-mail Luke

